
Last Updated: August 26, 2026
Every college in Karnataka claims "excellent placements" in their brochures. But having tracked college placements across Karnataka since 2006 through our education directories, the reality is that most placement data published by colleges is misleading. Some inflate numbers, some count internships as placements, and some include salary figures from a single outlier student. This guide teaches you how to read placement records critically so you choose a college based on facts, not marketing.
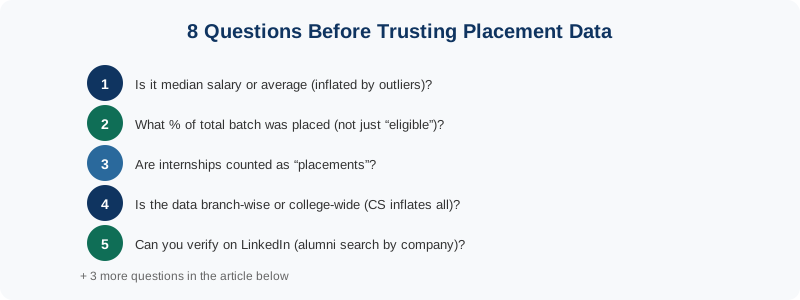
Last Updated: September 9, 2026
Why Placement Records Matter
For engineering, management, and professional courses in Karnataka, the placement record is arguably the most important factor after academic quality. A college with a 70% placement rate at Rs 4-5 lakh average salary gives you better career outcomes than a college with a 30% placement rate even if the latter has one student placed at Rs 20 lakh. The overall picture matters more than outlier numbers.
5 Key Numbers to Look For
1. Placement Percentage
This is the most important number. It tells you what percentage of eligible students actually got placed through campus recruitment. A good engineering college in Karnataka should have 60-80% placement rate. A great one will have 80-95%. Below 50% is a red flag. Always ask: is this percentage of total students or only students who registered for placements? Some colleges exclude students pursuing higher studies or those who opted out, making their percentage look artificially high.
2. Average Package (CTC)
The average package tells you what a typical student can expect. For Karnataka engineering colleges in 2026, a healthy average is Rs 4-6 lakh per annum for mid-tier colleges and Rs 6-12 lakh for top-tier colleges like RVCE, BMSCE, MSRIT, and PES. For MBA colleges, average packages range from Rs 6-10 lakh at good colleges. Be cautious of colleges that only publish the highest package without sharing the average.
3. Median Package
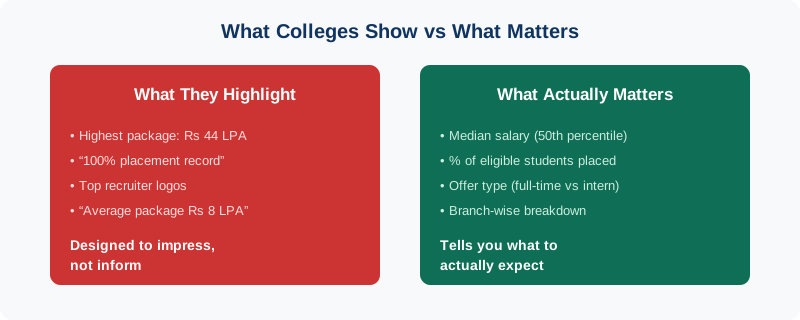
The median is more honest than the average because it is not skewed by a few outlier high packages. If a college says "average package Rs 8 lakh" but the median is Rs 4 lakh, it means a few students with Rs 20+ lakh offers are pulling the average up while most students actually get around Rs 4 lakh. Ask for median if the college does not publish it.
4. Highest and Lowest Package
The highest package makes headlines but the lowest package tells you the floor. If the highest is Rs 25 lakh but the lowest is Rs 2 lakh, the range is very wide and the college experience is inconsistent. A college with a highest of Rs 12 lakh and lowest of Rs 4 lakh shows more consistent quality across students.
5. Number of Recruiting Companies
More companies visiting campus means more opportunities and more negotiating power for students. Top Karnataka engineering colleges attract 100-300 companies. Mid-tier colleges attract 30-80. Fewer than 20 recruiting companies is concerning. Also check the quality of recruiters. 50 small local companies is not the same as 20 companies including Infosys, TCS, Wipro, Accenture, and product companies.
Red Flags in Placement Data
Only highest package mentioned: If a college proudly displays "Highest Package Rs 44 LPA" but does not share average or median, they are hiding the full picture. One exceptional student does not define the college placement quality.
Percentage based on "eligible" students: Some colleges exclude students who scored below a certain GPA, those pursuing higher studies, or those who did not register for placements. Ask for the percentage based on total final-year students.
Counting internships as placements: A 6-month internship stipend of Rs 15,000/month is not the same as a full-time job offer. Ask specifically about full-time placement offers, not internship conversions.
Combining on-campus and off-campus: On-campus placements happen through the college training and placement cell. Off-campus means the student found the job independently. Some colleges combine both to inflate their placement percentage. Ask for on-campus numbers specifically.
No year mentioned: If the college says "our students get placed at Rs 8 lakh average" without specifying which year and batch, the data could be from their best year 5 years ago. Ask for the most recent graduating batch data.
How to Verify Placement Claims
Talk to alumni: Connect with recent graduates (2024-2025 batch) through LinkedIn. Ask them directly about their placement experience, salary, and whether the college claims match reality.
Check NIRF rankings: The National Institutional Ranking Framework requires colleges to submit verified placement data. NIRF rankings at nirfindia.org show placement percentages and median salaries that are independently verified.
Visit during placement season: If possible, visit the college during October-March when placements happen. You can see how many companies actually visit and how the process is organized.
Ask for the placement report: Good colleges publish annual placement reports. If a college refuses to share detailed placement data, that itself is a red flag.
Placement Benchmarks for Karnataka Colleges 2027
Engineering (Top Tier - RVCE, BMSCE, MSRIT, PES): 85-95% placement rate, Rs 6-12 lakh average, Rs 20-50 lakh highest.
Engineering (Mid Tier - DSCE, NHCE, RNSIT, AIT): 60-80% placement rate, Rs 4-6 lakh average, Rs 10-20 lakh highest.
MBA (Top Tier - IIM-B, Christ, Symbiosis): 90-100% placement rate, Rs 10-25 lakh average.
MBA (Mid Tier): 60-80% placement rate, Rs 4-8 lakh average.
Medical/Dental: Placements are less relevant as most graduates go into practice or higher studies. Focus on NEET PG qualification rates instead.
Frequently Asked Questions
Do all colleges publish placement data?
No. Many colleges, especially those with poor placement records, avoid publishing detailed data. If a college is reluctant to share placement statistics, consider it a warning sign.
Is a high placement percentage more important than a high average salary?
Yes. An 85% placement rate at Rs 5 lakh average is better than a 40% placement rate at Rs 8 lakh average. The first college gives most students a job. The second leaves more than half the batch without placements.
Should I trust placement data on college websites?
Treat it as a starting point, not as verified truth. Cross-check with NIRF data, alumni feedback, and independent sources like CollegesInfo.org before making decisions.
Recommended Reading
How to Read College Placement Data – What Numbers Mean
| Metric | What College Claims | What to Actually Check | Red Flag |
|---|---|---|---|
| Highest Package | Rs. 40 LPA | How many students got this? (Usually 1-2) | Only highest package highlighted, median not mentioned |
| Average Package | Rs. 8 LPA | Mean vs median – outliers inflate average | Average much higher than median |
| Placement Percentage | 95% placed | Placed in what – full-time jobs or internships? | Internships counted as placements |
| Companies Visited | 200+ companies | How many made actual offers? | Companies visited vs companies that hired are very different |
| Branch-wise Data | Overall college average | Ask for CSE vs ME vs Civil separately | Only overall average shared, branch data unavailable |
Official Sources: Information on this page is sourced from All India Council for Technical Education (AICTE) and University Grants Commission (UGC), the primary regulatory bodies governing this subject in India.
What Placement Statistics Actually Mean – A Decoder
| Metric | What Colleges Claim | What It Actually Means |
|---|---|---|
| Highest Package | "Rs 50 LPA highest package" | One student, one offer – often a foreign offer or stock-heavy package. Ignore this number entirely. |
| Average Package | "Rs 12 LPA average" | Can be inflated by a few high outliers. Ask for MEDIAN package instead – much more representative. |
| Placement Rate | "100% placement" | Often means 100% of students who registered for placement – not all students. Many students opt out, pursue higher studies, or are family business students. Ask: percentage of TOTAL batch, not registered batch. |
| Companies Visited | "500+ companies visited" | Includes companies that sent ONE email or visited for internships. Ask how many gave full-time offers. |
| LPA figure | "7.5 LPA average" | LPA = Lakhs Per Annum. Verify if it's CTC (Cost to Company, includes all benefits) or take-home. CTC is always higher than take-home by 20-30%. |
Questions to Ask Colleges During Campus Visits
Before admitting your child or yourself to any college, ask these specific questions – not the vague ones on the brochure:
1. What percentage of the TOTAL graduating batch (not registered batch) got placed last year? Get the exact number – batch size vs placed count.
2. What was the median CTC (not average, not highest) for your branch last year? The median is the middle number – it tells you what a typical student gets, not what the top 5% get.
3. Which companies come for core engineering roles vs IT/software roles? For Mechanical/Civil/EEE students, ask specifically about core sector recruiters – many "placement" figures are dominated by IT companies hiring from all branches.
4. How many students from your branch went to higher studies (GATE, MBA, UPSC) vs direct placements? Some branches have 40-50% going for GATE – those students aren't in placement figures but it doesn't mean placements failed.
5. Can I speak to 2-3 alumni who graduated 3-5 years ago (not current students)? Current students are on campus and under pressure to speak positively. Alumni with jobs are independent.
KCET vs COMEDK Placement Gap – Does It Exist?
A common concern: do KCET students get the same placement as COMEDK students at the same college? The answer is yes – placement is branch-specific and merit-based after joining. KCET vs COMEDK is an admission route, not a placement category. Once inside the college, your placement depends on your branch, your CGPA, your skills and your interview performance – not your admission route. Companies don't ask how you got in. The only relevant factor is which branch you're in and what you've built during 4 years.
Need help with admission?
CollegesInfo.org helps students secure admission to colleges they are eligible for under that college's actual published criteria. Chat with us on WhatsApp or explore admission assistance.